Ingesting X-Forwarded-For Header into Azure Monitor
Something I see very often is the ability to see a Client’s IP in IIS Logs. This scenario is especially interesting when you are using an Application Gateway in front of your IIS Web Servers (Iaas).
My first question would be….do you even PaaS?
The reality is that there are still a very large number of web servers out there and this scenario is more common than you think.
The challenge here is getting that Client IP (c-ip) through the AppGw and into the IIS Logs on the VM.
And as you are in Azure, taking those IIS Logs and ingesting them BACK into Azure Monitor for easier querying……good bye LogParser (And good riddance)!
While Azure Monitor supports ingesting IIS Logs by default, it doesnt support ingesting the X-Forwarded-For header, sounds silly right!? You need to use custom log ingestion, read on!
Pre-requisites
There are a few things you are going to want to do on both your AppGw as well as your IIS Configs, before setting up the Custom Log ingesting.
IIS Setup
You first need to set IIS to log the X-Forwarded-For header in IIS logs by adding a custom field.
Head into IIS and open Logging at server level.
This is all easier if done at Server level, and you will see why later
Add the X-Forwarded-For field using the “Select Fields” button, under the Logging module:
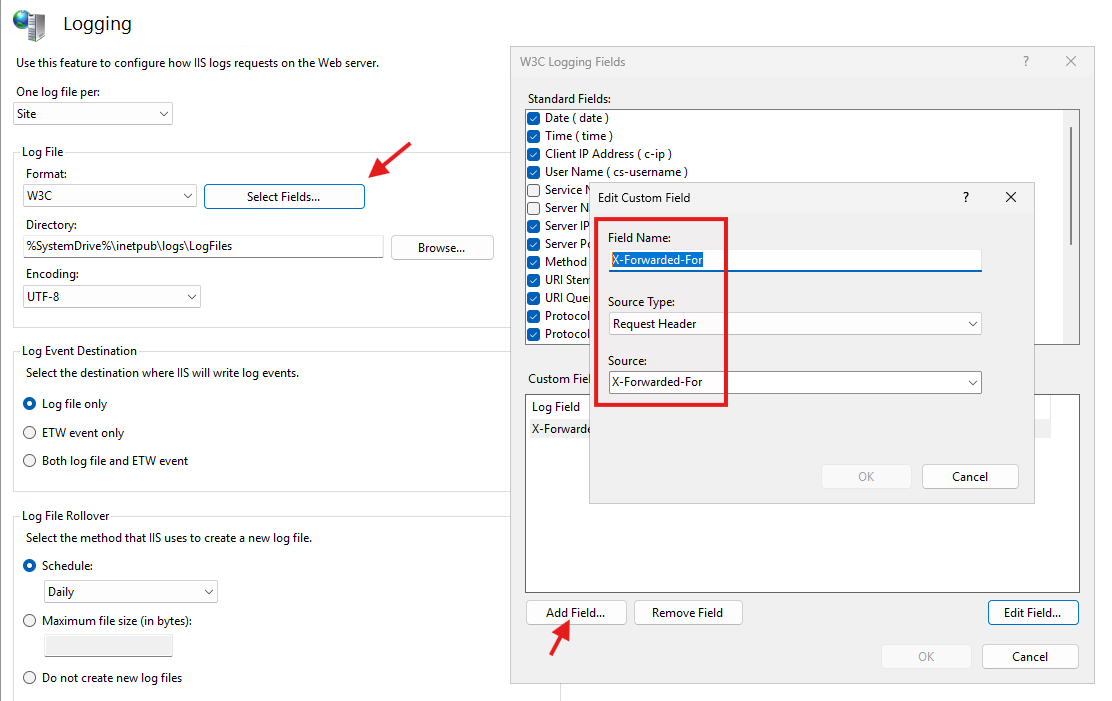
Don’t forget to hit the Apply button (Top right) once you have added the field.
At this point you want to ensure you have set all your standard fields. If you change them later its gets tricky to update the rest of the config. So take the time to ensure what fields you want to include in your logs and ingestion.
Application Gateway
AppGw supports and logs the X-Forwarded-For headers by default, but it includes the client port in the string too.
Note the IP:PORT value at the end:
1
2025-06-18 11:01:28 10.0.0.4 GET /favicon.ico - 443 - 10.0.2.5 HTTP/1.1 Mozilla/5.0+(Windows+NT+10.0;+Win64;+x64)+AppleWebKit/537.36+(KHTML,+like+Gecko)+Chrome/137.0.0.0+Safari/537.36+Edg/137.0.0.0 - www.host.com 404 0 2 0 109.146.111.249:61335
Rewrite
You can remove the mostly useless client port from the header using the rewrites config on your AppGw > Rewrites > Add Rewrite Set.
- Give it a name and associate to the applicable AppGw Rules.
- Set the Rewrite rule conditions as follows:
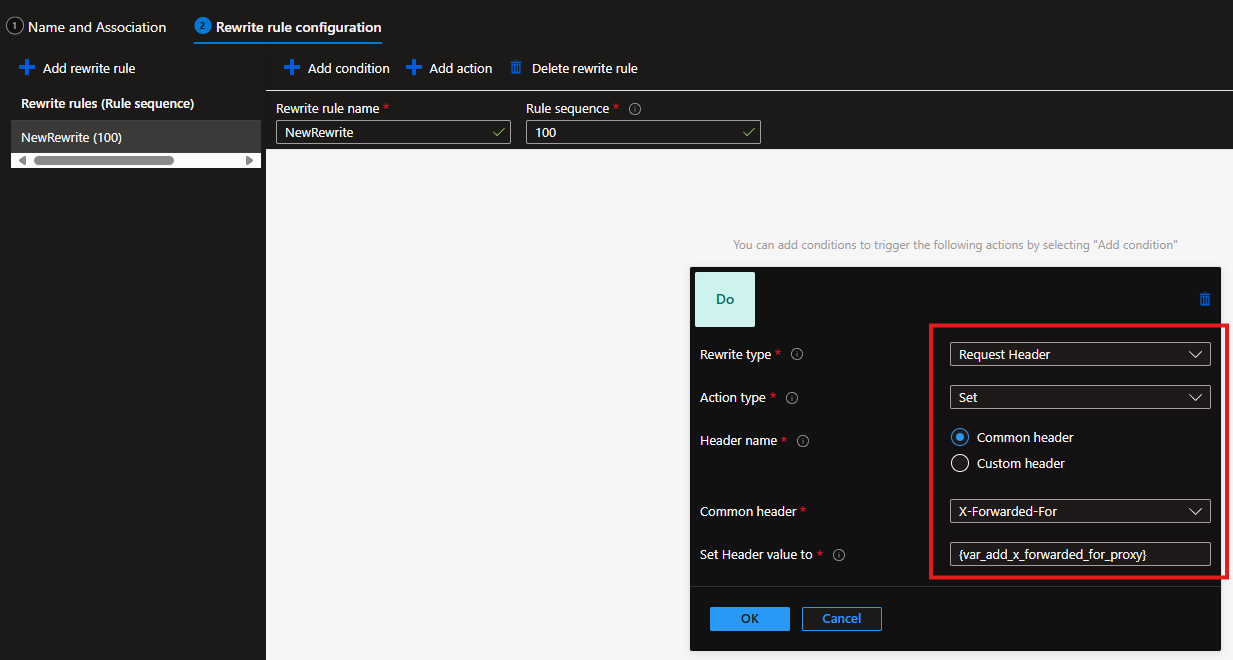
- Rewrite type: Request Header
- Action type: Set
- Header name: Common header
- Common header: X-Forwarded-For
- Set Header value to: {var_add_x_forwarded_for_proxy}
Once that is done, your logs will now look should something like this:
1
2025-06-18 11:01:28 10.0.0.4 GET /favicon.ico - 443 - 10.0.2.5 HTTP/1.1 Mozilla/5.0+(Windows+NT+10.0;+Win64;+x64)+AppleWebKit/537.36+(KHTML,+like+Gecko)+Chrome/137.0.0.0+Safari/537.36+Edg/137.0.0.0 - www.host.com 404 0 2 0 109.146.111.249
Getting Custom Log Ingestion Set Up
There are a few things to do here and there are a few ways to get then done, but the methods below worked well for me, when using the Portal.
I have not yet attempted this via PowerShell, although it can be done that way too. Arguably its probably way easier/faster using PowerShell. If I get round to it, I will add that method/code here too.
Creating all the Resources
To create the Custom Table correctly you will need to do the following:
- Create a table schema. This is decided by IIS and the Standard and Custom log fields that are setup in IIS.
- Create a transformation query. This is used to convert the data during ingestion from the IIS log table format and into the Custom Log Table schema.
- Create The Custom Table. Tthis method seems strange but it works.
- Recreate the DCR. Due to some Portal randomness we have to recreate the DCR to get it to work correctly, after creating the table.
Table Schema
The easiest way to get your schema is to open the LATEST copy of your IIS Log file.
Default IIS log path = C:\inetpub\logs\LogFiles\W3SVC*
In the file, find the LATEST #Fields comment entry:
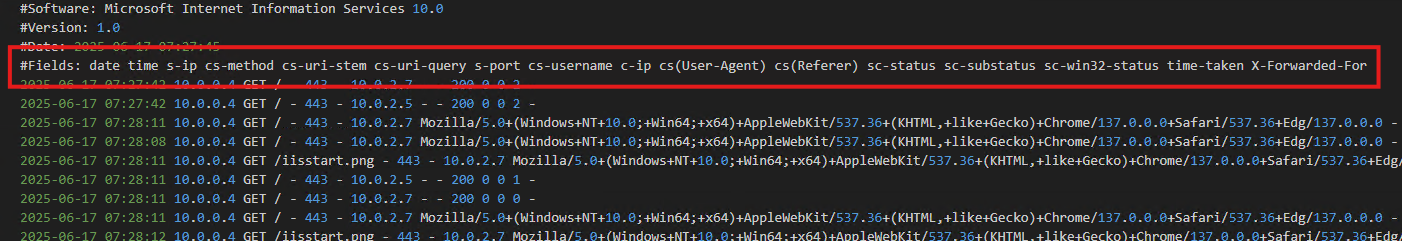
Copy them out to VS Code/Editor of choice:
1
date time s-ip cs-method cs-uri-stem cs-uri-query s-port cs-username c-ip cs-version cs(User-Agent) cs(Referer) cs-host sc-status sc-substatus sc-win32-status time-taken X-Forwarded-For
We use these to create a JSON file, which is an example schema for Azure.
In this example, I have used the same log entry as above in the IIS setup. If you have the same fields selected you can copy the schema below, or at least use the below as a starting point.
The JSON values here dont matter, merely a reference but it’s important that you get the order right.
Schema Example File:
1
2
3
4
5
6
7
8
9
10
11
12
13
14
15
16
17
18
19
{
    "TimeGenerated": "2025-06-17T19:04:33Z",
    "s_ip": "10.0.0.4",
    "cs_method": "GET",
    "cs_uri_stem": "/favicon.ico",
    "cs_uri_query": "-",
    "s_port": 443,
    "cs_username": "-",
    "c_ip": "10.0.2.5",
    "c_version": "HTTP/1.1",
    "cs_User_Agent": "Mozilla/5.0",
    "cs_Referer": "-",
    "cs_host": "www.host.com",
    "sc_status": 404,
    "sc_substatus": 0,
    "sc_win32_status": 0,
    "time_taken": 1,
    "x_forwarded_for": "109.146.111.249"
  }
The order will represent the column position in the IIS logs. With Date and Time from IIS Logs will combine into TimeGenerated in position 1, so to represent that I’ve added numbers to each column from the IIS Headers here:
1
#Fields: (0)date (1)time (2)s-ip (3)cs-method (4)cs-uri-stem (5)cs-uri-query (6)s-port (7)cs-username (8)c-ip (9)cs-version (10)cs(User-Agent) (11)cs(Referer) (12)cs-host (13)sc-status (14)sc-substatus (15)sc-win32-status (16)time-taken (17)X-Forwarded-For
Transformation Query
You need this as you need to set the Transformation Query once the Schema has been applied.
Transformation Query:
1
source | project d = split(RawData," ") | project TimeGenerated=todatetime(strcat(d[0], " ", d[1])), s_ip=tostring(d[2]), cs_method=tostring(d[3]), cs_uri_stem=tostring(d[4]), cs_uri_query=tostring(d[5]), s_port=toint(d[6]), cs_username=tostring(d[7]), c_ip=tostring(d[8]), cs_version=tostring(d[9]), cs_User_Agent=tostring(d[10]), cs_referer=tostring(d[11]), cs_host=tostring(d[12]), sc_status=toint(d[13]), sc_substatus=toint(d[14]), sc_win32_status=toint(d[15]), time_taken=toint(d[16]), x_forwarded_for=tostring(d[17])
Edit the above, if yours is different, to “match” the IIS Log columns (number) to the Column in your Custom Log Table (name).
For example:
cs_method=tostring(d[3])
- cs_method is the name of the column in your Custom Log Table that is being created.
- tostring(d[3]) denotes the Column number you assigned from IIS Logs Schema. In this case 3.
Once you have those two things sorted, we can go ahead and create the table.
Create The Custom Table
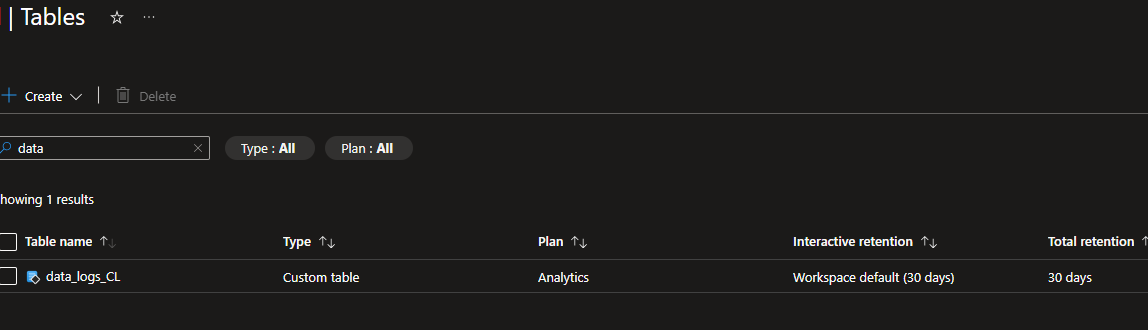
- Navigate to your Log Analytics Workspace. This is where the Custom Table will live.
- Under settings, choose Tables, and create a new custom log (DCR Based) table.
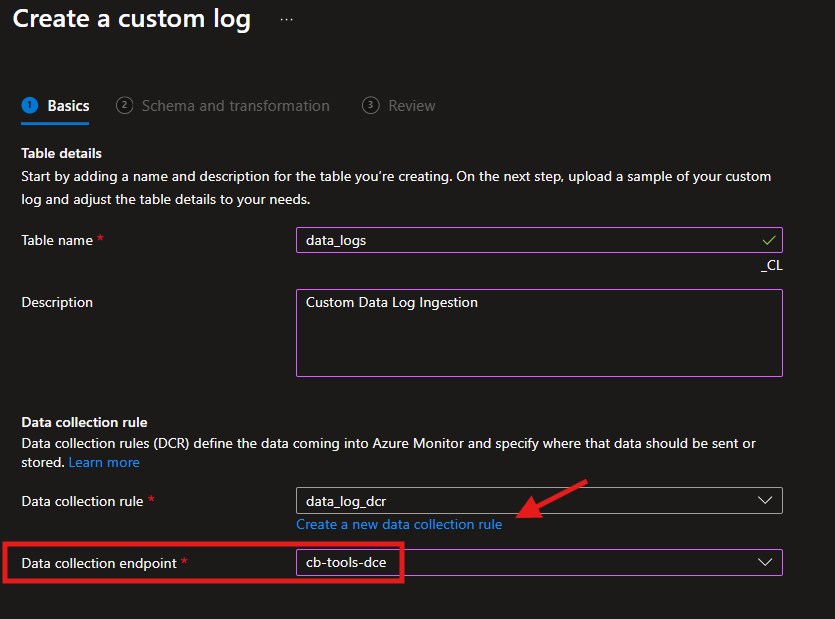
- Specify table name and description as required.
We will create a new Data Collection Rule, initially. We will need to recreate it (In a bit) to get it all to work correctly.
Note: the Portal also requires an existing DCE (Data Collection Endpoint) here, so set one up but it’s not used actually. When using PowerShell to do all this, you won’t need a DCE here.
- Provide the JSON file you created earlier as the sample file.
If the JSON file is correct, your schema should line up with the values as expected, as below. If you get any errors, it’s going to be your syntax, so double check your syntax/format.
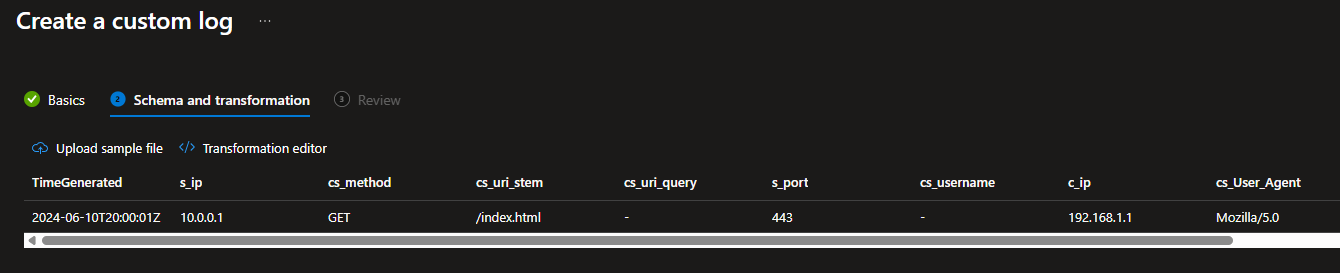
- If it all looks correct, then hit next and create. The table creation will take around 5-10mins to create so dont expect to see it straight away in the table list.
Recreate the DCR
At this point we have a Custom Table and DCR created. But the DCR will not be working. I suspect this is because we havent yet been able to set the location of the source files, as this step is missing from all the work we have done so far. Most likely a Portal development issue that may be solved in time. I reckon PS wont have the same issue.
To get around this issue, I delete the DCR created earlier. The table will remain, so don’t be concerned about that.
In this example our DCR was called data_logs_dcr, so we delete that. You will probably need to remove the resource association before being able to delete it, DCR > Resources > Disassociate.
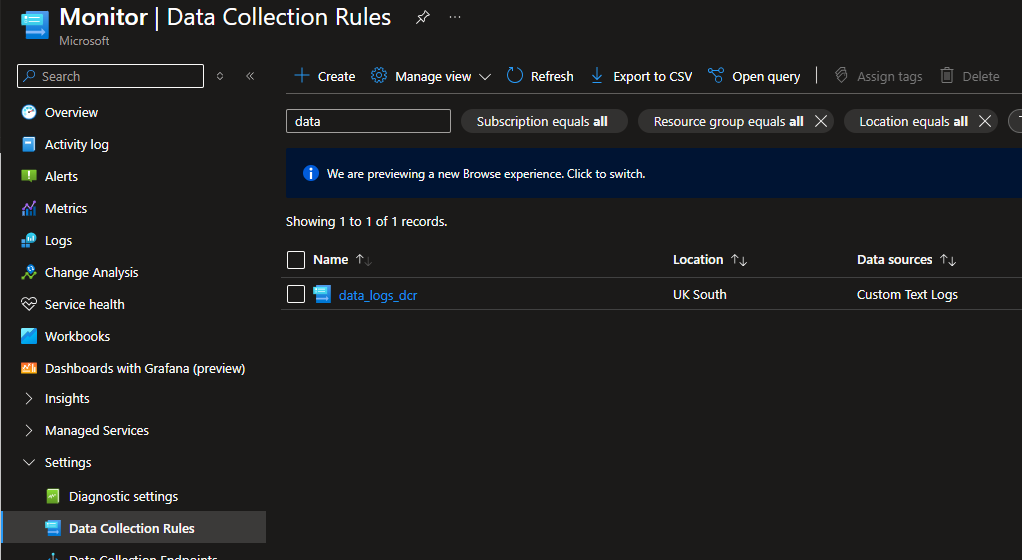
Once that has been deleted, give it a minute and then go ahead and create a new DCR:
- Basics - Give it a name (I used the same name), Sub, RSG etc.
- Resources - Associate your VM(s).
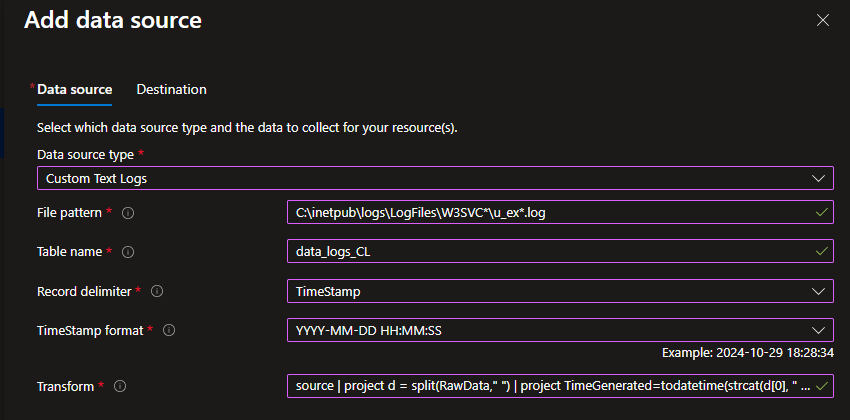
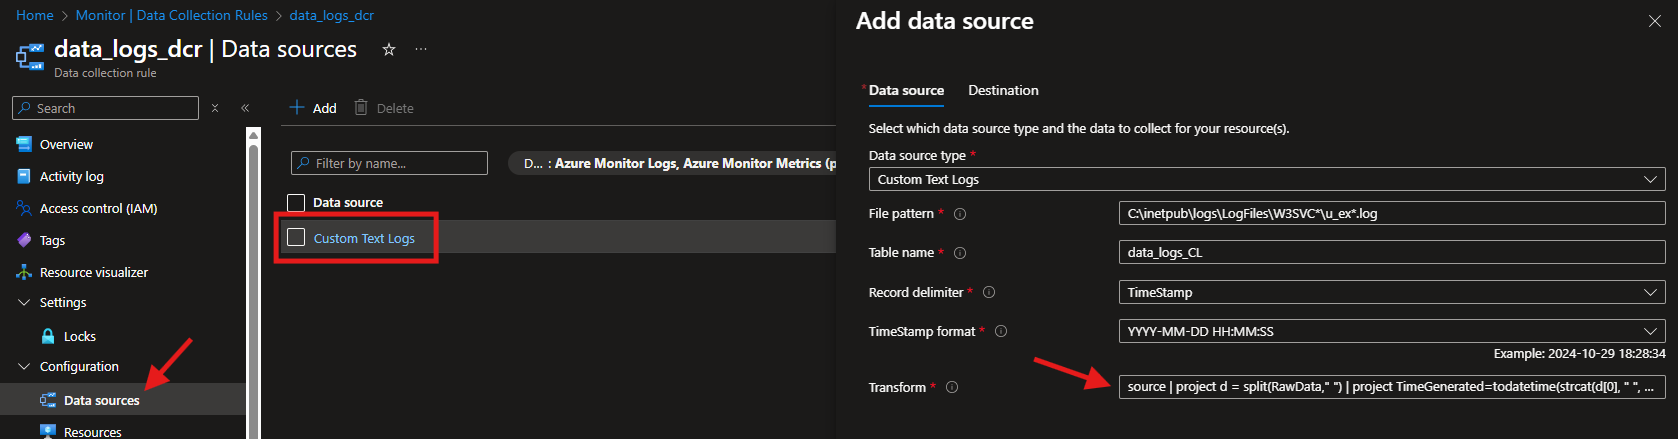
- Collect and Deliver - This is the important bit add your Data Source as
Custom Text Logs- NOT IIS Logs.- File pattern - This is the source of your Logs, mine is default:
C:\inetpub\logs\LogFiles\W3SVC*\u_ex*.log - Table name - This needs to be the same as your table:
data_logs_CL - Record delimiter - IIS Logs delimitates with the date/time:
TimeStamp - Time Stamp Format -
YYYY-MM-DD HH:MM:SS - Transform - This will be your transformation query we created earlier. It will need to be a single line, so ensure no returns are included.
- File pattern - This is the source of your Logs, mine is default:
- Destination - Choose the relevant Log Analytics Workspace to send the data to.
- Create the DCR.
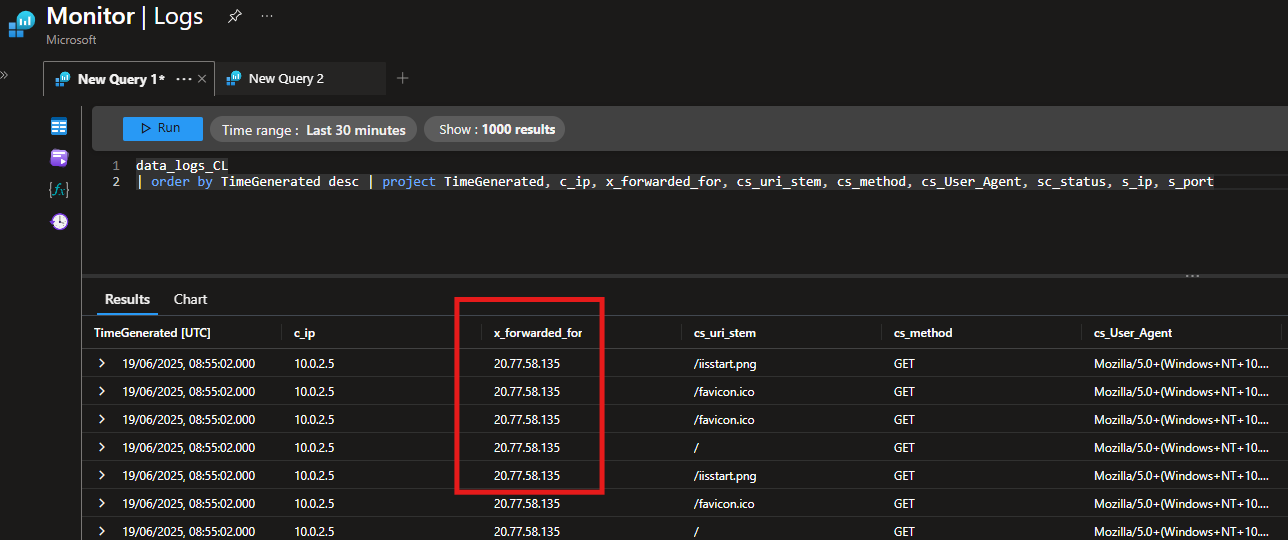
At this point if you had no issues, data will start ingesting in about 10-15mins.
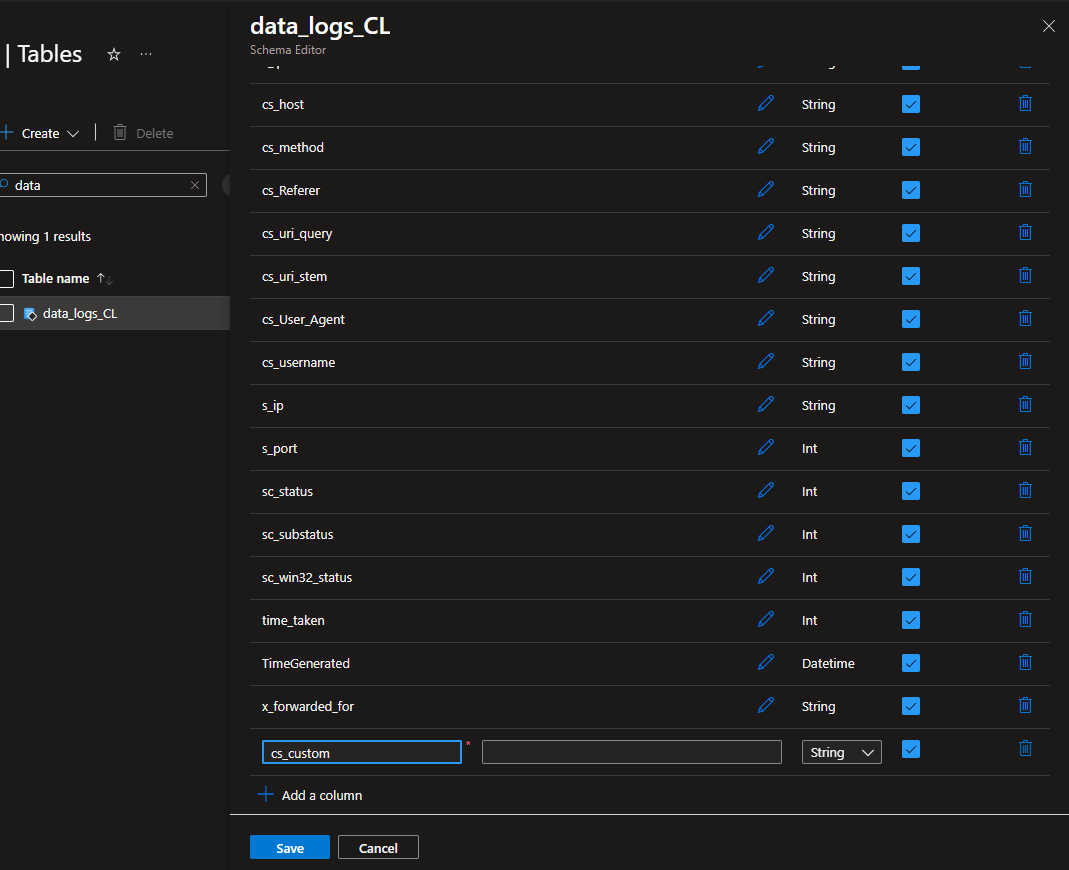
Adding Columns After Setup
There will be a scenario where you need to add another column after you have set all this up. This is entirely possible.
You need to do a few things to get it set properly:
- Update the source transformation query, in the DCR, to include the new column. Remember the order that the column is in, from your log headers, if you get this incorrect, it will misalign the data in LAW.
- Update the Table Schema with the new column > LAW > Tables > Edit Table Schema. This update will take around 15mins to take effect, so be patient with the ingestion to see the result.